Data Visualization
Business Activity Monitoring "BAM" is the most common form of data visualtion used in the operations today. It is a general term that describes any effort to help people understand the significance of data by placing it in a visual context. Patterns, trends and correlations that might go undetected in text-based data can be exposed and recognized easier with data visualization software.
Data visualization refers to the techniques used to communicate data or information by encoding it as visual objects (e.g., points, lines or bars) contained in graphics.
As eye catching as these products may be, many people often forget that it is only as good as the data source. If the data is not clean or completely trusted, then the picture is a great work of fiction. Data warehousing and scrubbing is the essential part of BAM and dashboard deployment. That's what AIT ensures.
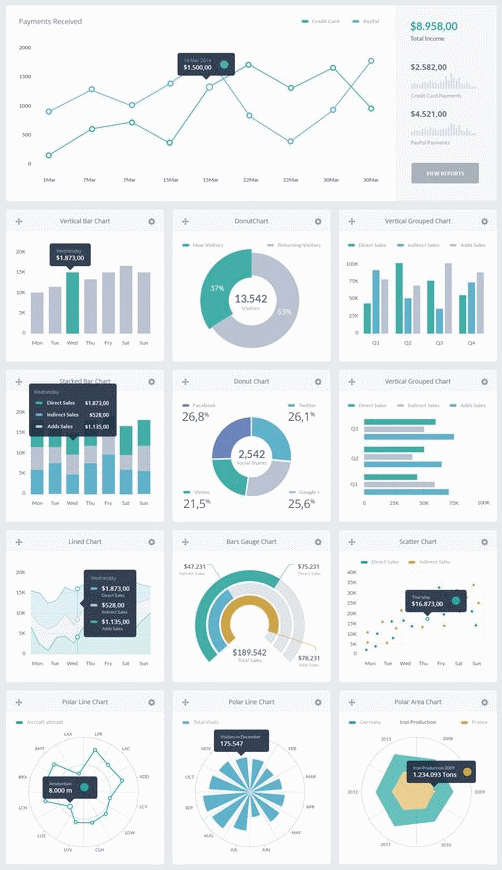
If a picture is worth a thousand words,
then a dashboard is worth a thousand data tables.